Hypoplastic Sand
The hypoplastic model for sand takes into account the following important properties of soils:
- Stiffness and strength depend on the current level of effective stress \(\boldsymbol{\sigma}\)
- Stiffness and strength depend on the current density characterized by the void ratio \(e\)
- Stiffness depends on the direction of loading (loading vs. unloading)
For detailed description of the hypoplastic model calibration, see the following document. Brief description of the parameters is given below.
Model parameters
The model distinguishes between material parameters that are constant for all possible states of a particular soil and state variables that evolve during straining. In this sense the hypoplastic model is fundamentally different from the Mohr-Coulomb model which employs distinct values of its material parameters for the same soil in different states (loose or dense). In particular, to describe the hypoplastic model for sand requires eight material parameters:
- \(\varphi_{c}\) - Friction angle in the critical state
- \(h_s\) and \(n\) - Parameters controlling the shape of limiting void ratio curves (normal compression lines and critical state line)
- \(e_{c0}\), \(e_{d0}\) and \(e_{i0}\) - Reference void ratios specifying positions of limiting void ratio curves
- \(\alpha\) - Controls the dependency of peak friction angle on relative density
- \(\beta\) - Controls the dependency of soil stiffness on relative density
and one state variable, namely the void ratio \(e\).
Parameter \(\varphi_{c}\)
Parameter \(\varphi_{c}\) is the critical angle of internal friction. In coarse-grained soils, the most straightforward way to determine \(\varphi_{c}\) is the measurement of the angle of repose. If the soil has larger proportion of fine grains, angle of repose test may not be suitable. Then, triaxial shear tests (either drained or undrained) on normally consolidated samples are recommended.
Parameters \(h_s\), \(n\), \(e_{c0}\), \(e_{d0}\) and \(e_{i0}\)
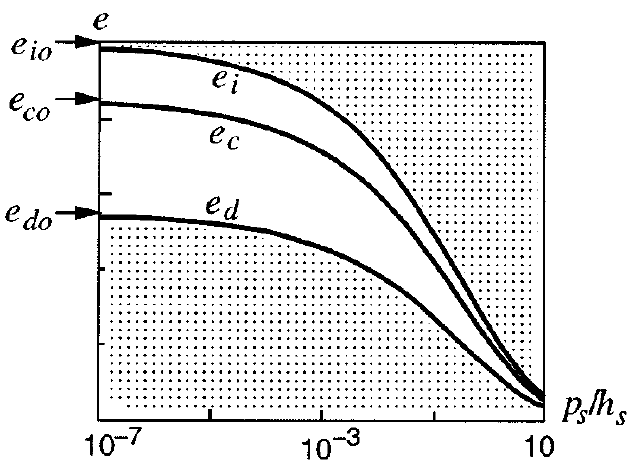
An essential ingredient of the sand hypoplastic model controlling its properties are limiting void ratio curves. The model distinguishes three such curves: \(e_{i}\)-line (theoretical maximum void ratio curve), \(e_{c}\)-line (critical state line) and \(e_{d}\)-line (minimum void ratio line). These curves are mathematically described by (Bauer, 1996) \begin{equation} \frac{e_i}{e_{i0}}=\frac{e_c}{e_{c0}}=\frac{e_d}{e_{d0}} = \exp \left[ - \left( \frac{-\operatorname{tr}{\boldsymbol{\sigma}}}{h_s} \right)^{n} \right] \end{equation} and are plotted in Figure 1 to show how \(e_{c0}\), \(e_{d0}\) and \(e_{i0}\) control their positions. The parameter $h_s$ controls the slope of these curves and $n$ controls their curvature.
The parameter $e_{c0}$ can be, most conveniently, calibrated through oedometric measurements on a loose sand sample. The parameter $e_{i0}$ is typically found from an empirical expression $e_{i0}=1.2 e_{c0}$. The parameter $e_{d0}$ can be found using a small-amplitude cyclic shearing test at constant pressure, or an empirical estimation $e_{i0}=0.5 e_{d0}$ can be adopted. Finally, the parameters $h_s$ and $n$ can be obtained using the shape and slope of the oedometric test performed on a loose sand sample (this curve is an approximate estimation of $e_c$).
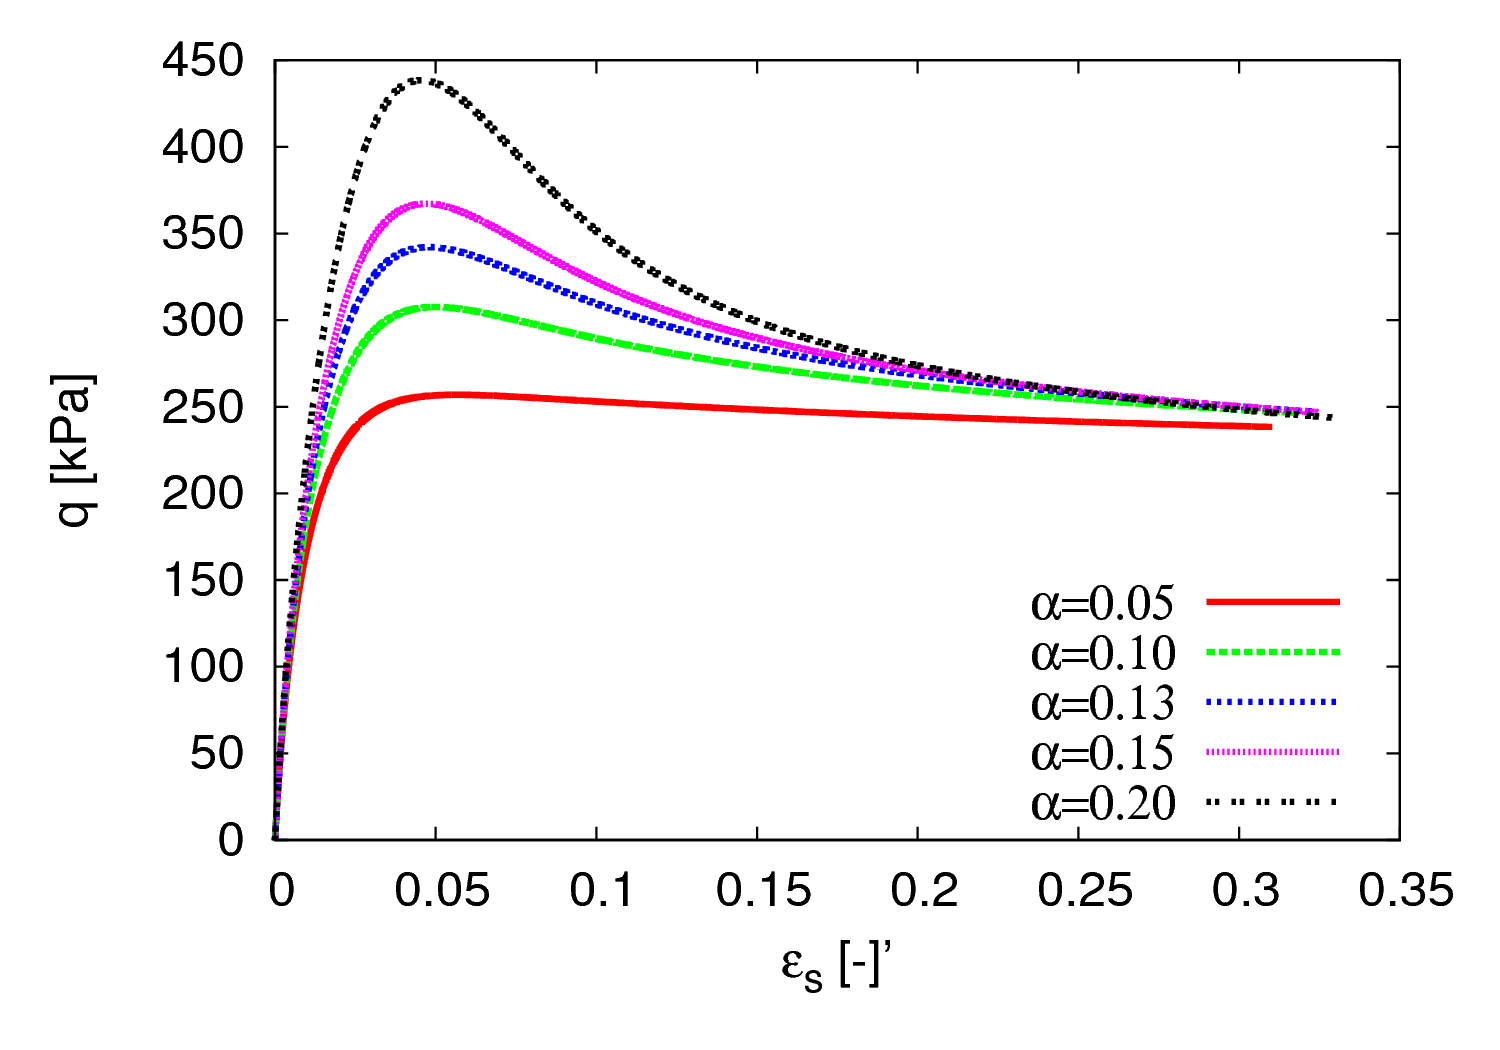
Parameter \(\alpha\)
The parameter \(\alpha\) controls the dependency of peak friction angle on the relative void ratio. It can be calibrated by means of a single element simulation of a drained triaxial shear test on a soil with higher relative density compared to the critical state relative density. Increasing $\alpha$ increases the peak friction angle, as shown in Figure 2.
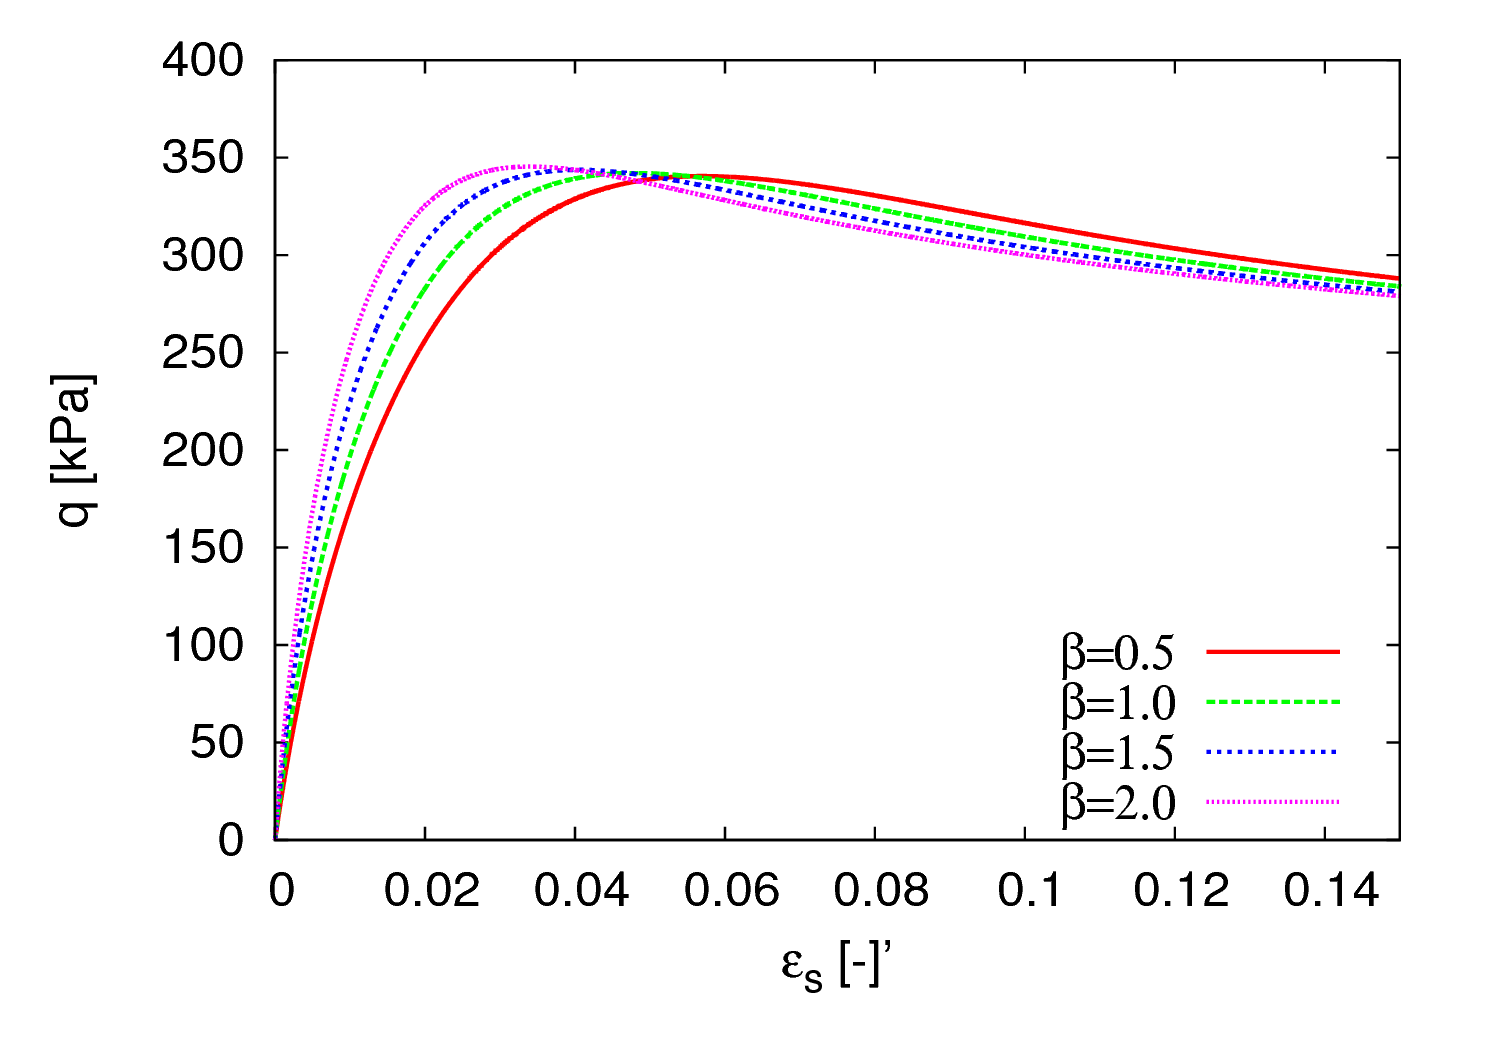
Parameter \(\beta\)
The parameter \(\beta\) influences both the bulk (in the overconsolidated state) and shear stiffness. It is best calibrated by fitting the stress-strain curve of a drained triaxial test on a dense sample (the same test as that used for calibration of \(\alpha\) can be used). Increasing $\beta$ increases the shear stiffness, as shown in Figure 3.